Prototypr.ai MCP
Easily search and export designs from your workspace and community marketplace with MCP. Access all your design assets through natural language queries.
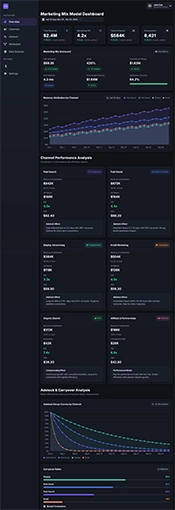
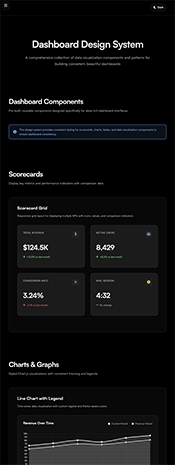
Introducing Dashboard AI
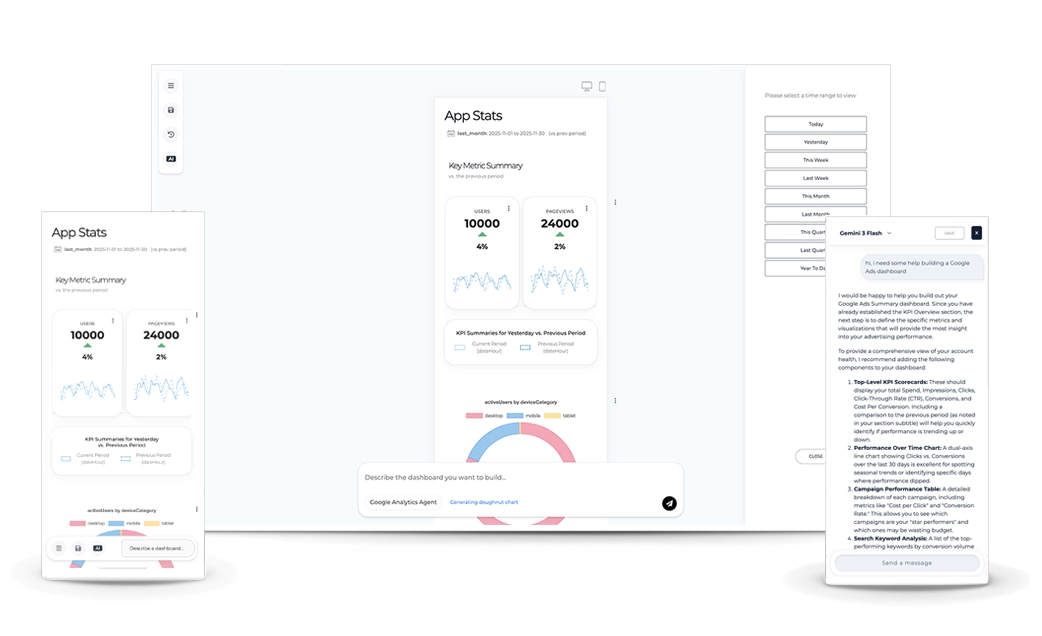
Dashboard AI helps you generate Google Analytics dashboards for campaigns and digital products, then use AI Chat to turn performance data into faster, clearer insight.
Watch the short to see how easy it is to build an AI dashboard, summarize performance, and explore what’s driving change.
LEARN MORE ABOUT DASHBOARD AI'S GOOGLE ANALYTICS CAPABILITIES3 ways to explore your data with AI
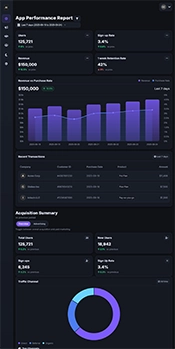
Generate Google Analytics dashboards with AI using natural language and build reports around the questions your team needs to answer.
Unlock GA4 AIUse AI Chat to summarize trends, explore performance, and understand what’s driving KPI change with added context from MCP.
See what AI Chat can doCreate high-fidelity dashboard mockups with AI and start aligning on reporting objectives before data engineering begins.
Make dashboards with AI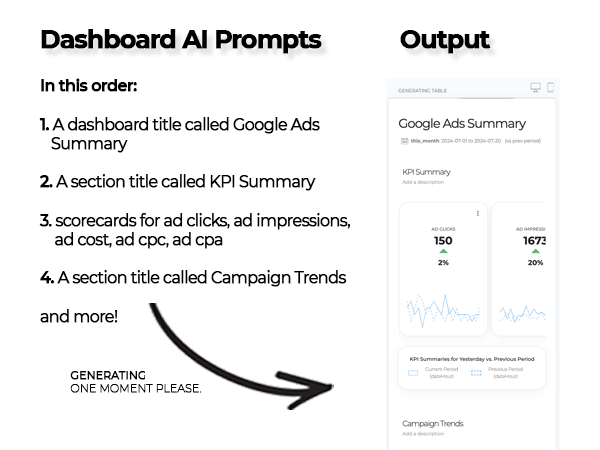
Built on top of the Google Analytics API and a finely tuned GPT model, this AI dashboard experience helps teams turn questions into working dashboards faster using natural language.
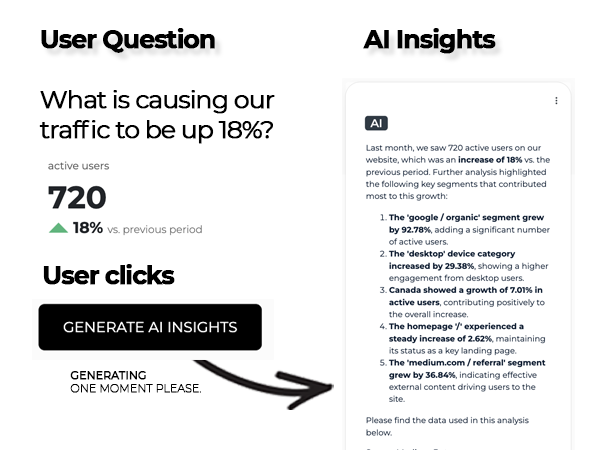
Use AI to understand performance over time, surface KPI drivers, and identify the segments behind changes in your data.
prototypr.ai makes it easier to chat with your Google Analytics data using AI. Teams can ask questions in natural language, explore trends faster, summarize dashboards, and generate insights with less friction.
Analytics teams are often asked to define measurement requirements for new user experiences. Instead of manually reviewing interfaces and documenting everything from scratch, web-enabled AI agents can visit webpages, identify measurement needs and speed up analytics planning.
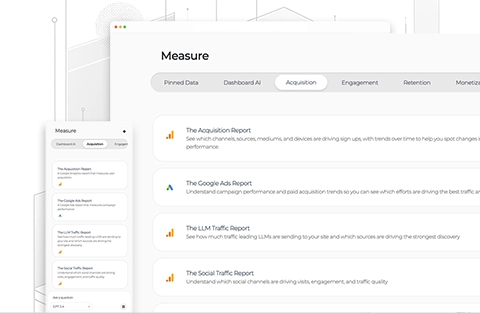
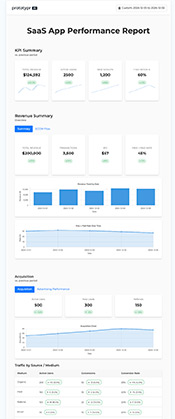
Connect Google Analytics to your prototypr.ai workspace to unlock reports across acquisition, engagement, retention, and monetization.
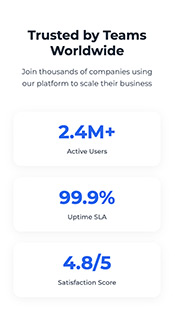
Preview AI dashboards insideA huge THANK YOU to the first 10000+ people who signed up to prototypr.ai! Your feedback is sincerely appreciated and helps make analytics more accessible and better for everyone.

Led by prototypr.ai creator Gareth Cull, this study demonstrates how building a Growth Intelligence Layer on top of Google Analytics transformed a failing activation flow. By combining AI-powered reporting with an AI Advisor fully aware of his analytics and product stack, he identified the precise friction points stalling early activation, leading to a 53% increase in Day 1 retention.
"Structure works when motivation exists. It does not work when introduced before value."
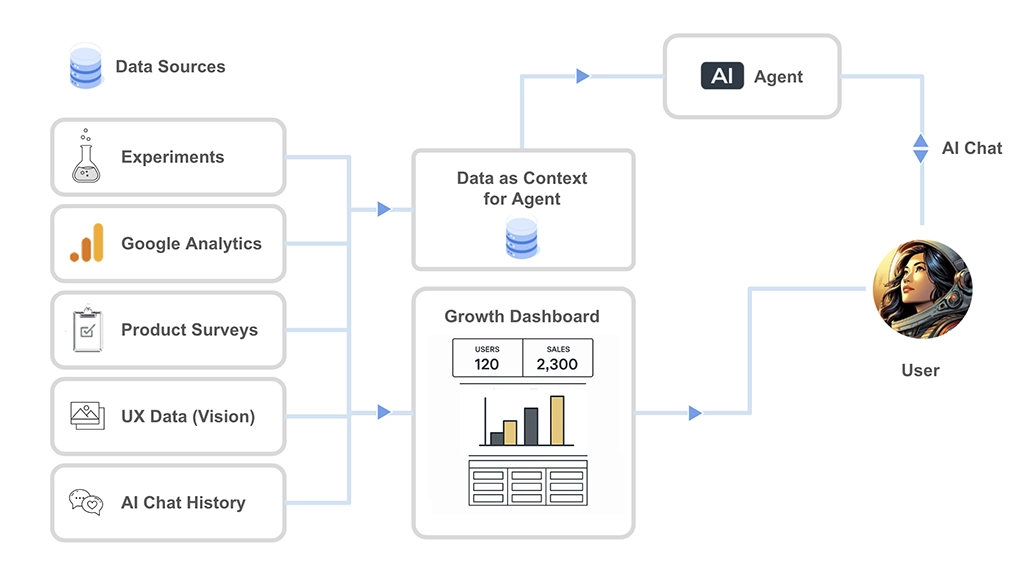
With prototypr.ai Analytics, teams can connect analytics, surveys, and UX data in one place, then use AI chat to explore how those signals fit together. The result is faster answers to business questions and insights teams can act on.
Learn more about Product Analytics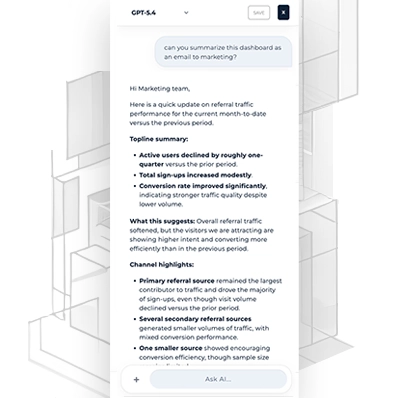
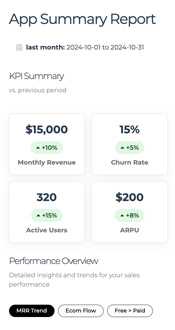
Simply open up AI chat in any Dashboard AI experience and ask it to summarize the dashboard as a draft email to marketing. Then edit the draft, validate the data and send it out to your team. It's that easy!
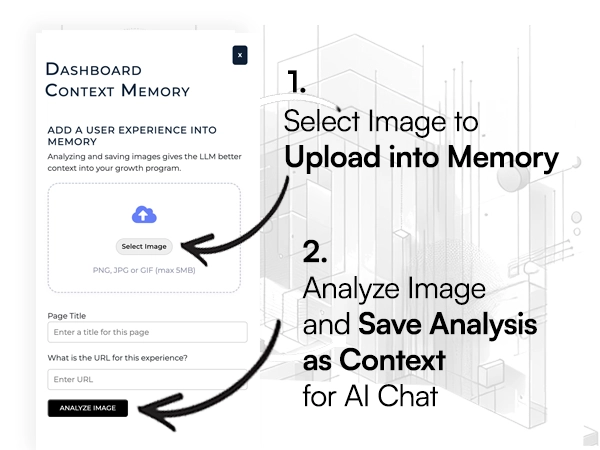
Good analysis depends on context. With AI Memory, teams can upload UX images and other supporting inputs so their Analytics Agent has a better understanding of the experience behind the data. The result is more informed analysis and answers that better reflect what is actually happening in the product.
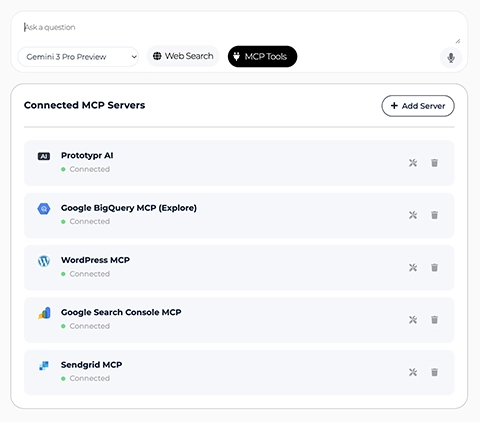
prototypr.ai uses MCP to connect the data sources teams rely on every day and bring that context into AI chat. The result is more grounded answers, richer reporting, and decision support that reflects what is really happening across the business.
Learn more about MCP Tools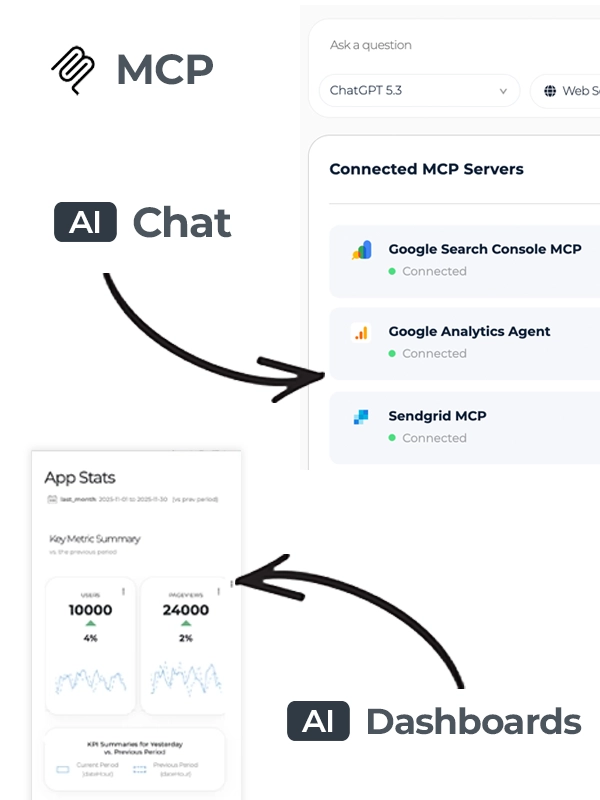
Use MCP to connect the data sources teams rely on every day. Our custom MCP integrations power premium lifecycle reports across Search Console, Stripe, and SendGrid, giving teams a clean way to explore performance and ask questions grounded in real business data.
Preview MCP dashboards insideConnect to leading data sources, power dashboards and expand what your AI can do. Open source, transparent, and built by our data team for your data team.
Easily search and export designs from your workspace and community marketplace with MCP. Access all your design assets through natural language queries.
A custom Google Analytics 4 Agent as an MCP server. Powered by a fine tuned GPT Model and the Google Analytics API.
An Open Source Google BigQuery MCP server that enables teams to explore their BigQuery datasets and run SQL queries using natural language.
An Open Source Google Search Console MCP server that enables you to query the GSC API with natural language and get insights into the performance of your SEO initiatives.
An Open Source Sendgrid MCP server that enables you to save HTML templates to Sendgrid, pull a list of templates, and get statistics about the performance of your email marketing program.
An open source Stripe MCP server that brings revenue and payment data into prototypr.ai so teams can unlock monetization reports and ask better questions about business performance.
Bring your data products to life today..

Instead of debating ideas on slides or in meetings, give stakeholders a dashboard they can react to immediately. AI‑generated mockups make abstract concepts tangible — helping teams agree on layout, structure, and intent before any BI setup or development work begins.

AI mockups eliminate endless revision cycles. Everyone sees the same dashboard early, aligns on the layout, and signs off on the final design. Once approved, simply export the code and move straight into implementation — with no backtracking or redesigns.
Upload a whiteboard photo, napkin sketch, or rough screenshot and instantly generate a high‑fidelity dashboard with clean, editable HTML. This compresses early exploration, alignment, and developer handoff into a single step — dramatically accelerating timelines.
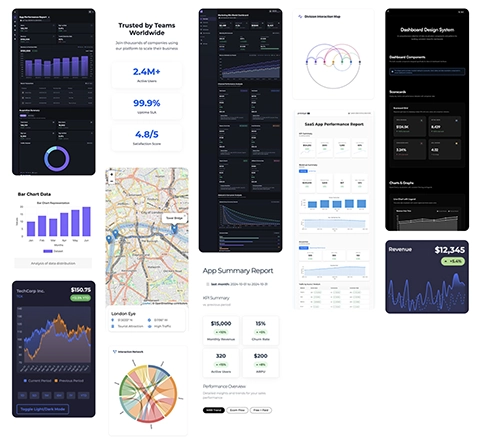
Kickstart your dashboard projects with a curated gallery of templates. Import them into your workspace, remix them with AI, or use them to inspire the storytelling approach for your next data project.
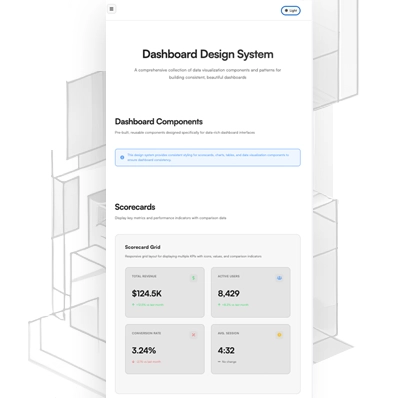
Most data teams don’t have the time or resources to create a standardized design system. With Dashboard AI's design system, teams can speed up design, development and produce more consistent and professional user experiences across every dashboard.
View Dashboard Design System TemplateShare your dashboard or data visualization ideas to a growing community library.


Go beyond prompt engineering and discover how the FACT framework helps you structure data context for smarter, more capable data agents. With practical examples and code.
Read Context Engineering ArticleEverything you need to know about Building Dashboards with AI
An AI dashboard is a business interface powered by artificial intelligence that helps people quickly understand and explore their data, uncover insights, and answer questions about business performance.
Unlike traditional dashboards that rely on manual setup and configuration, AI dashboards allow users to generate dashboards using natural language—making it faster to go from raw data to meaningful insights.
They also include an integrated AI chat layer, enabling users to explore data more deeply, segment metrics, connect additional data sources, and investigate questions that go beyond what is visible in a static dashboard.
In practice, an AI dashboard helps you:
The result is a faster path from data to understanding—and from understanding to action.
Dashboard AI is an AI‑powered dashboard generator built by prototypr.ai that helps teams create high‑fidelity analytics dashboards and mockups in seconds using large language models.
It includes a custom Google Analytics integration that allows you to generate, edit, and refine fully structured dashboards using a fine‑tuned GPT model, making it easy to go from data to insight without manual setup.
Dashboard AI also supports MCP integrations, enabling you to connect additional data sources and use AI chat to explore, summarize, and analyze your data using natural language. This helps you answer deeper questions and uncover insights beyond what’s visible in a static dashboard.
Traditional BI tools require manual setup, configuration, and querying to build dashboards, which can slow down the process of getting insights from data.
Dashboard AI uses artificial intelligence to generate Google Analytics dashboards instantly and allows you to explore and understand your data using natural language.
Instead of building dashboards step by step, you can describe what you want and have it created for you in seconds.
This approach reduces the time it takes to build dashboards, makes analytics more accessible to non-technical users, and helps teams move faster from data to insight, ultimately enabling better, more informed decision-making.
Using AI to build dashboards significantly reduces the time and effort required to move from data to insight.
Instead of manually configuring charts, writing queries, or designing layouts, AI can generate complete dashboards instantly and help you understand what’s happening in your data.
Key benefits include:
AI dashboards allow teams to spend less time building dashboards and more time making decisions.
An AI dashboard generator uses large language models to translate prompts, data sources, or visual references into fully structured dashboards.
Instead of manually configuring charts or writing queries, you can simply describe what you want to see, and the system will generate the layout, visualizations, and metrics automatically.
Once the dashboard is created, you can continue editing it using natural language or explore your data further using AI chat to refine insights and get feedback.
When working with the Google Analytics integration, this process becomes even more direct. You can describe the data you want and pair it with a visualization—for example, “generate a scorecard for active users” or “create a table of active users by source/medium.” The fine‑tuned GA4 GPT model will then generate the corresponding components based on your request.
This approach makes it faster and easier to move from a question to a working dashboard, without needing to manually build or configure each element.
Yes. Dashboard AI connects directly to the Google Analytics API and uses a fine‑tuned GA4 GPT model to generate dashboards, summaries, and insights from your Google Analytics data.
This integration allows you to quickly build dashboards that reflect your traffic, user behavior, and key performance metrics without needing to manually build reports with drop downs.
If you would like to see how this works in practice, you can watch this short demo: AI Dashboard Generator featuring a GA4 GPT x Gemini Flash
Most dashboards are generated in seconds, allowing you to go from an idea, prompt, or sketch to a fully interactive dashboard in a very short amount of time.
Dashboard AI with Google Analytics integration is powered by a custom GPT model that was fine tuned using pairs of natural language queries with corresponding GA4 API queries.
When generating mockups or other data products, you can use leading models such as Google Gemini 3.1 Pro, Google Gemini 3 Flash, and Claude Opus 4.6.
Yes. You can generate dashboard mockups, explore templates, and experiment with AI-generated layouts for free inside prototypr.ai.
When you get started, you are given 15 credits to try the platform and create dashboards using AI.
To connect real data sources like Google Analytics and access advanced features such as MCP integrations and AI Chat for deeper analysis, a premium membership is required, with plans ranging from $29–$99 per month.
Yes. Dashboard AI allows you to export dashboards as clean, editable HTML.
This makes it easy to move from a prototype or mockup to implementation, enabling faster collaboration between product, analytics, and engineering teams.