Build a Knowledge Base for Your A/B Tests with AI
Centralize learnings, avoid repeated mistakes, and accelerate experimentation cycles.
Everything you need to know about A/B testing and statistical significance
A/B testing is a method of comparing two or more versions of a web page or user experience to determine which performs better. Users are randomly shown variations, and statistical analysis is used to evaluate performance against a conversion goal such as clicks or signups.
This A/B testing calculator helps determine whether the difference in performance between a control (A) and a variation (B) is statistically significant. You enter sample sizes and conversions for each variant, choose a one-tailed or two-tailed test, and receive results at a 95% confidence level.
A 1-tailed test is used when you have a specific directional hypothesis, such as expecting one variant to outperform another. A 2-tailed test is used when you want to detect any significant difference, regardless of direction. The test type should be chosen before running the experiment.
Important factors include choosing an appropriate sample size, randomizing users, running the test long enough, accurately measuring conversions, considering user segments, and selecting a confidence level such as 95% to determine statistical significance.
A/B test results should be documented with the test objective, hypothesis, experiment design, sample size, duration, conversion metrics, key findings, and recommendations. Clear documentation helps teams reuse learnings and make informed decisions.
Centralize learnings, avoid repeated mistakes, and accelerate experimentation cycles.
1. Build an AI‑powered A/B Test Knowledge Base
Document every test with structured templates, automatically summarized by AI. Spot patterns, consolidate insights, and prevent repeating failed ideas across your team.
START YOUR KNOWLEDGE BASE2. Get Guidance from an AI Growth Advisor
Chat with an AI growth partner trained on your experiment history, survey insights, GA4 metrics, and UX data. Ask what to test next, validate experiment ideas, and uncover opportunities hidden in your data—instantly.
TRY GROWTH ADVISOR AI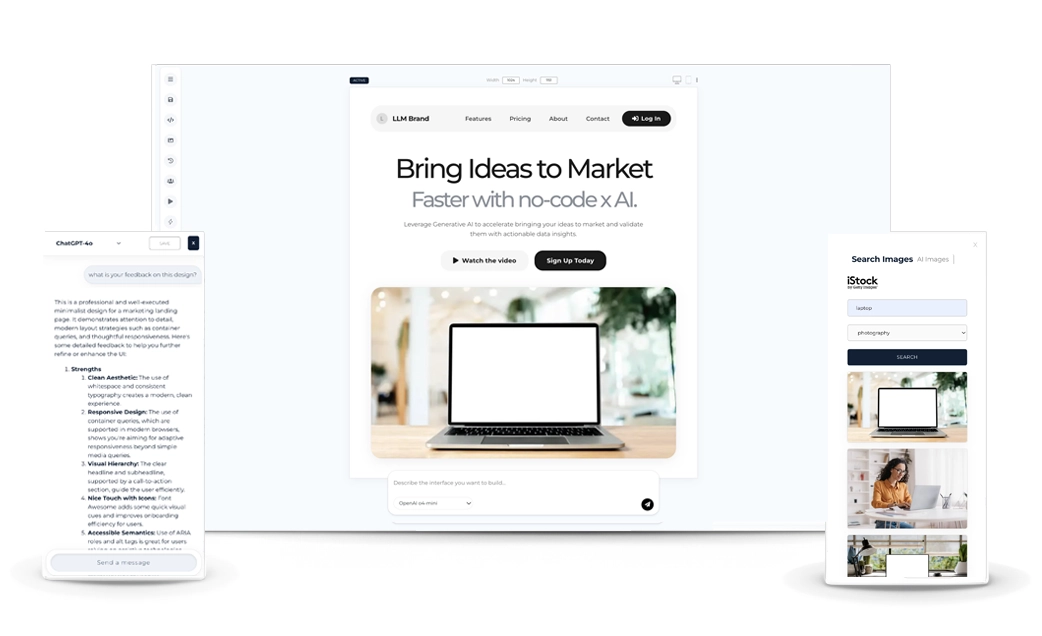
3. Generate High‑Converting Landing Pages
Create on‑brand landing pages in seconds using AI. Test value props, pricing, and visuals without design or engineering time. Perfect for validating messaging and driving conversion lift in your growth experiments.
CREATE A LANDING PAGE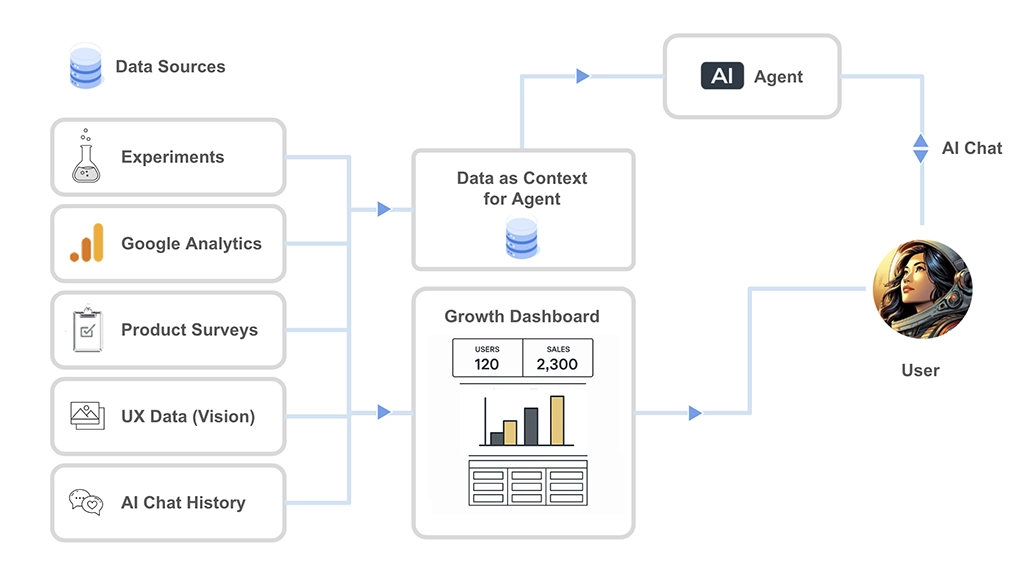
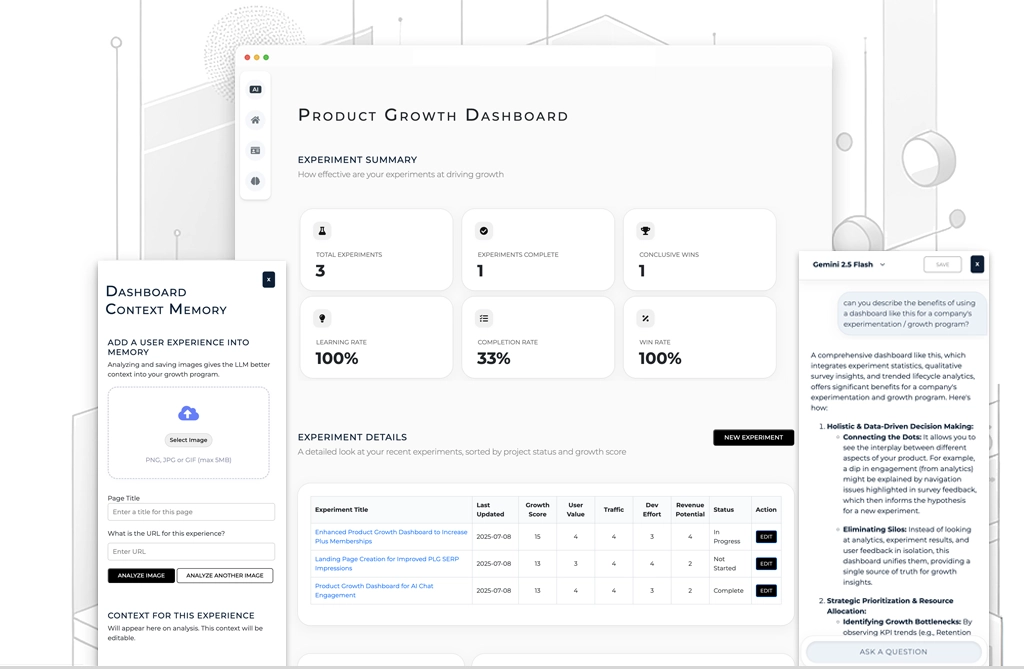
4. Understand Your Metrics with the Product Growth Dashboard
Connect Google Analytics, track retention, monitor acquisition trends, surface experiment impact, and let AI explain what’s changing—and why. Your full growth story in one place.
EXPLORE THE DASHBOARD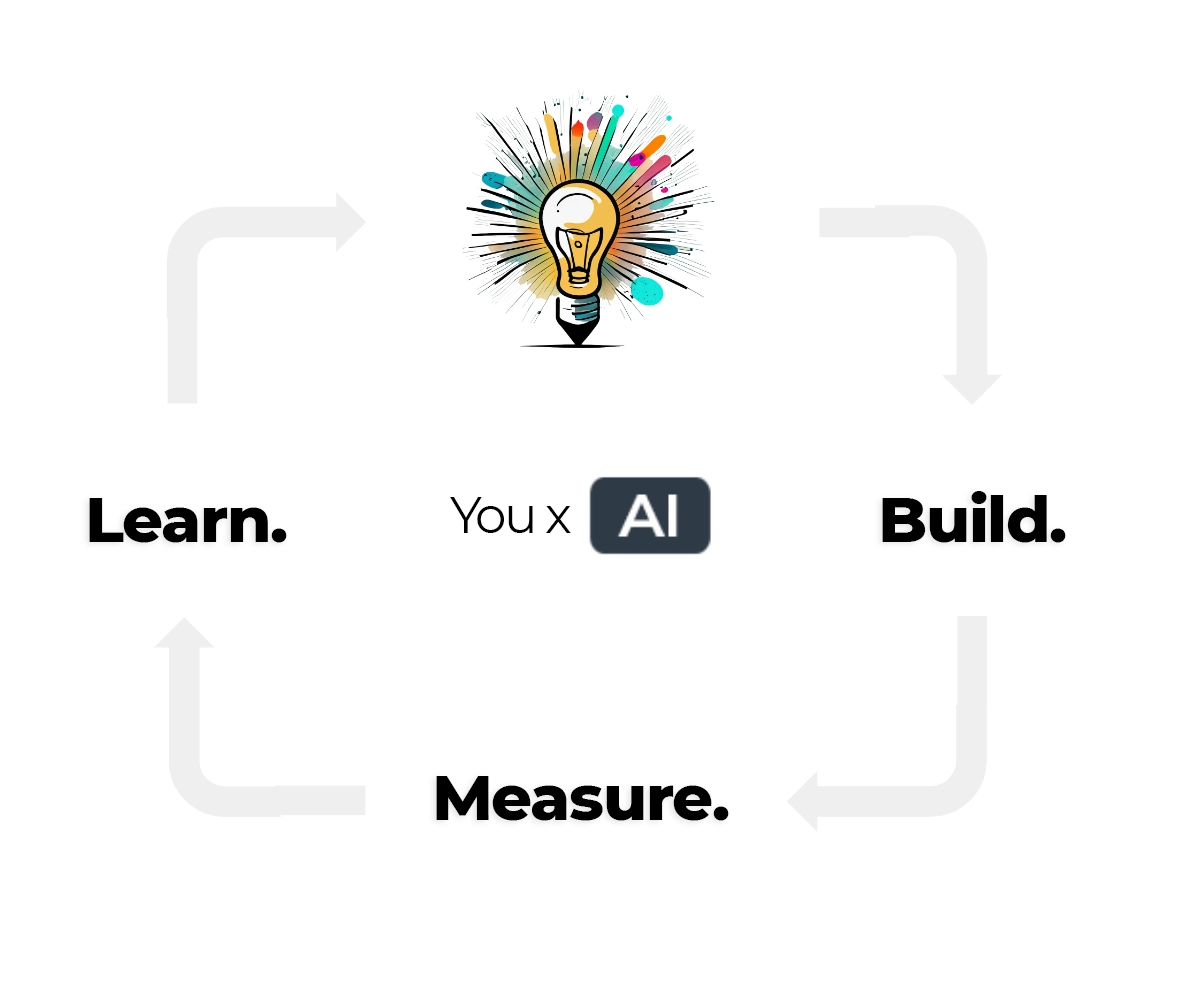
5. Build a Continuous Learning Loop
Prototypr.ai ingests your growth data and builds a living memory of what works for your product. Over time, your AI Growth Advisor gets smarter—helping you plan better tests, avoid past mistakes, and scale your experimentation program efficiently.
START LEARNING WITH AI