Building an onboarding flow with coffee x AI
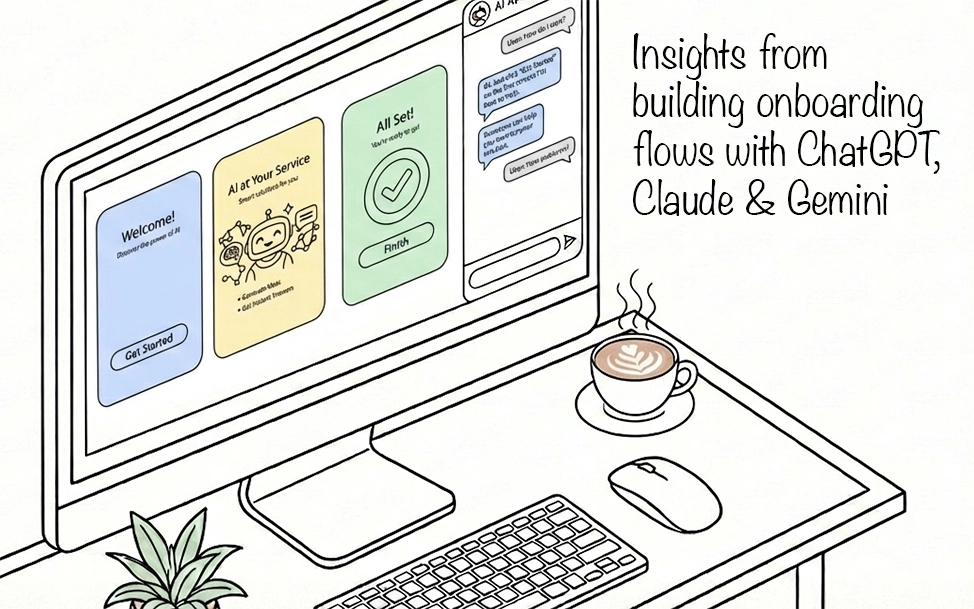
Insights from Building Onboarding Flows with ChatGPT, Claude and Gemini
 Gareth Cull
- What is an onboarding flow? An onboarding flow is the experience new users go through after signing up. Its purpose is to help them reach meaningful value as quickly as possible.
- Why does onboarding matter for retention? Onboarding has a direct impact on early retention, especially Day 1 and Week 1 return rates. If users experience value quickly, they are significantly more likely to return.
- What can I learn from reading this article? This is a detailed teardown of two onboarding experiences, why the first failed despite being logically sound, and how a “Lead with Value” redesign reshaped activation and improved day 1 retention by 53%.
- Who is this article for? This guide is for product managers, growth practitioners, founders, and anyone working on activation and early retention.
- How does AI fit into onboarding design? AI can be used as strategic collaborators (not just content tools) to design, prototype, and validate onboarding changes using real product data. The broader lesson is how AI, when connected to analytics and experimentation, can accelerate product learning.
Introduction
A good onboarding flow should get a new user to value as quickly as possible.
That sounds obvious. But in practice, it’s one of the hardest problems in Product.
The real challenge is not building onboarding screens. It is identifying where value actually begins. Is it understanding the product? Completing a setup? Accomplishing some task?
I initially believed it was helping the user understand the system. I was wrong.
Over the past few weeks, I rebuilt my onboarding flow from the ground up using ChatGPT, Claude, and Gemini APIs. Each model played a distinct role. ChatGPT shaped strategy. Claude structured the experience. Gemini made it fast enough to work.
The redesign increased Day 1 retention by 53 percent.
This article is a walkthrough of what I built, how I measured it, what failed, what changed, and why it worked. It is a real world case study in improving activation and retention using structured experimentation and AI connected to real product data.
If you care about measurable improvements in activation and early retention, this breakdown shows exactly what changed and why it mattered.
Table of Contents
This guide will cover the following:
- A Short Back Story
- My AI Setup: How I used ChatGPT, Claude, and Gemini to Redesign Onboarding
- A Tale of Two Onboarding Experiences: Pre vs. Post
- Measuring Onboarding Experiences with Google Analytics
- Onboarding Experiment Results: A Signifcant Lift in Retention
- 5 Lessons from Rebuilding Onboarding with AI
A Short Back Story
Over the years, I’ve built many onboarding flows. This article focuses on the two most recent versions inside prototypr.ai, which I’ll refer to as V3 and V4.
To understand why they evolved the way they did, it helps to understand the philosophy behind the product.
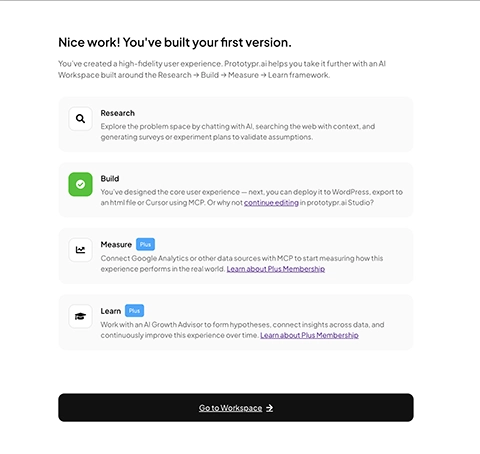
At its core, prototypr.ai is built around a simple idea: product growth should be structured. The platform is organized around four pillars: Research, Build, Measure, and Learn. It's designed to help teams move from idea to validated insight in a repeatable way.
Research clarifies the problem. Build turns ideas into tangible artifacts. Measure connects those artifacts to real data. Learn captures insight so the next iteration starts smarter than the last.
What makes this story more interesting is that the entire onboarding experiment was conducted inside that same system.
The strategy was drafted inside prototypr.ai. The hypothesis was documented and versioned. The onboarding prototype was generated within the Studio experience. Analytics were pulled directly into the workspace using an analytics agent. When statistical significance was reached, the experiment was updated and stored as a win inside the knowledge base.
In other words, the product was used to improve the product.
There is something slightly meta about this. The original onboarding experience, V3, was itself structured around the Research → Build → Measure → Learn (RBML) framework. It asked users to define a problem, articulate a hypothesis, generate a prototype, create a survey, and build a dashboard.
As a growth system, that logic was sound. As an onboarding experience, it failed.
Yet the redesign of that onboarding, V4, was created by applying the same framework at the product level. RBML did not fail. The sequencing did. Structure works when motivation exists. It does not work when introduced before value.
That distinction became the turning point.
What made this shift possible was not just structure, but composition. The next section explains how three different AI models were used together to turn that structure into measurable outcomes.
My AI Setup: Why I Use Three Models Instead of One
I get asked this a lot: why not just use one model?
The short answer is that no single model handles strategy, structure, and execution equally well. What mattered in this experiment was composition.
When you compress the distance between idea, prototype, measurement, and learning, iteration accelerates. That compression is what made it possible to redesign onboarding and measure a meaningful retention lift in weeks rather than months.
ChatGPT: The AI Growth Advisor
Inside prototypr.ai, ChatGPT functions as a context-aware Growth Advisor. It is connected to analytics, experiment history, survey feedback, UX analyses, and prior conversations.
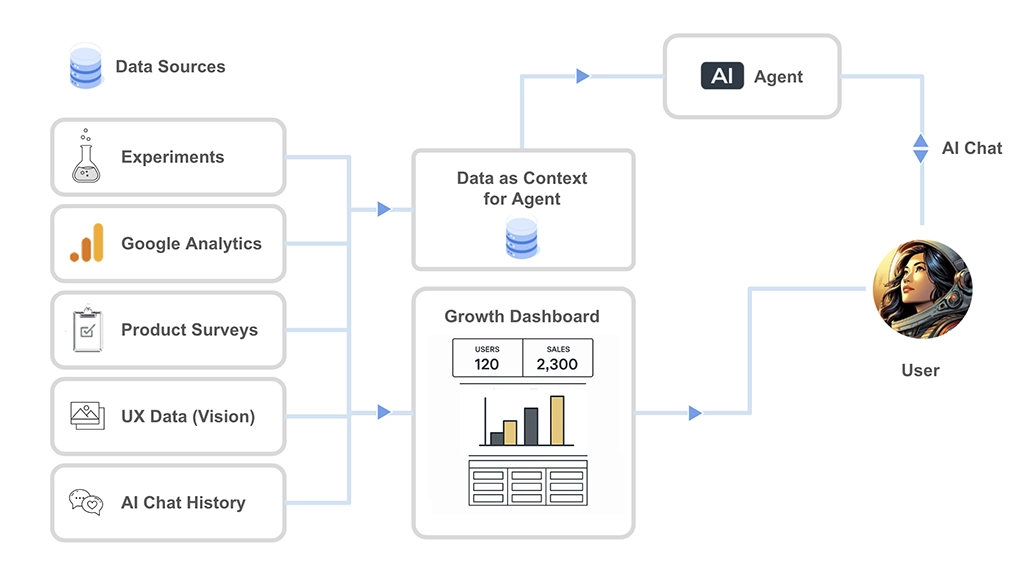
How ChatGPT is Connected to Data in prototypr.ai
And this context changes everything.
When a model has access to structured product data, historical experiments, and prior reasoning, its output shifts from generic suggestions to grounded analysis. It can reference baselines, challenge assumptions, generate hypotheses rooted in real metrics, and interpret results with awareness of what has already been tried.
Deliberately structuring data and memory this way allows models to reason with continuity instead of starting from zero each time. I’ve written more about this approach in a separate piece on context engineering if you’d like a deeper breakdown.
Having that layer in place allowed me to design V4 with confidence. The onboarding wasn’t redesigned on intuition. It was shaped through continuous dialogue with an advisor that understood my product, my users, and my past decisions.
At one point, I seriously considered calling this post What ChatGPT and I Learned Rebuilding My Onboarding Flow with Claude and Gemini
That wouldn’t have been inaccurate.
Without this context layer, iteration becomes guesswork. With it, each experiment compounds on the last.
Claude Opus: The Design Partner
Claude played a very specific role in this project: user experience design.
In my experience, Claude Opus 4.5 is exceptionally strong when working through detailed wireframes, multi‑step user flows, and UX iteration at a structural level. It handles layout refinement with a level of precision and visual reasoning that makes it ideal for thinking in systems before thinking in polish.
This is why I chose Claude over Gemini for early-stage design work. Gemini 3 Flash is an incredible model. It is fast, highly capable, and creatively strong. But when you are designing multi-step onboarding flows and need outputs that are nuanced, editable, and structurally coherent, Claude tends to produce more stable foundations. For the level of complexity I was aiming for, it simply worked better.
Below is a link to the original prototype that Claude designed for this project in prototypr.ai Studio.
Original v4 prototype for this onboarding flow
Explore the original v4 onboarding prototype built by Claude Opus 4.5
View DetailsOverall, I was really happy with structure of the flow and the minimalist design. Sure, it required some human refinement, but it brought the experience roughly 80 percent of the way to production. That structural head start made the later iteration process significantly more efficient.
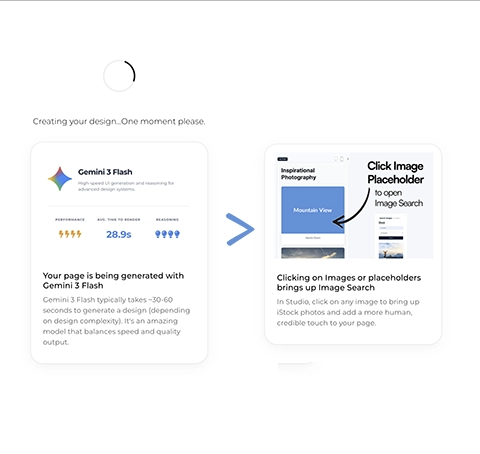
Gemini: The Engine That Makes It All Feel Instant
Gemini is the engine that makes this onboarding experience work.
It powers real‑time generation inside the onboarding flow with a level of speed that other similar models simply cannot match. If generation takes several minutes, momentum collapses. When output appears in under a minute, users feel progress. That psychological shift is what made a “lead with value” onboarding flow viable.
With Gemini 3 Flash, ui generation consistently lands under the 60 second range. Waiting three or four minutes, which was common with other more powerful models would have broken the experience in my opinion.
Gemini might not always match Claude’s design fidelity, but without its speed, V4 simply wouldn’t work.
Why Composition Matters
This setup is not about model preference. It is about coordinated capability.
Without strategy, iteration becomes random. Without structure, ideas stay abstract. Without speed, momentum dies.
Combining these models created a system where ideas could be tested quickly, measured accurately, and refined immediately. That coordination is what allowed onboarding V4 to move from hypothesis to statistically significant retention lift in a compressed timeframe.
The rest of this post shows how that system was used to fix an onboarding experience that, despite being logically sound, was quietly failing.
A Tale of Two Onboarding Experiences - Pre vs. Post
Onboarding V3 Teardown: Logical, Sincere, but the Wrong First Experience
From a product growth perspective, the original onboarding flow (V3) was not accidental. In fact, it was a sincere reflection of how I approach validating a problem with data.
I wanted a flow that could capture the core essence of a Research → Build → Measure → Learn framework that I've been building prototypr.ai around.
The V3 flow started with a Welcome or Thank you screen and then tried to guide the user through:
- Defining the problem they were trying to solve
- Generating a hypothesis to hold the idea accountable
- Creating a prototype
- Generating a survey to collect feedback on the prototype
- Creating a dashboard to measure the results
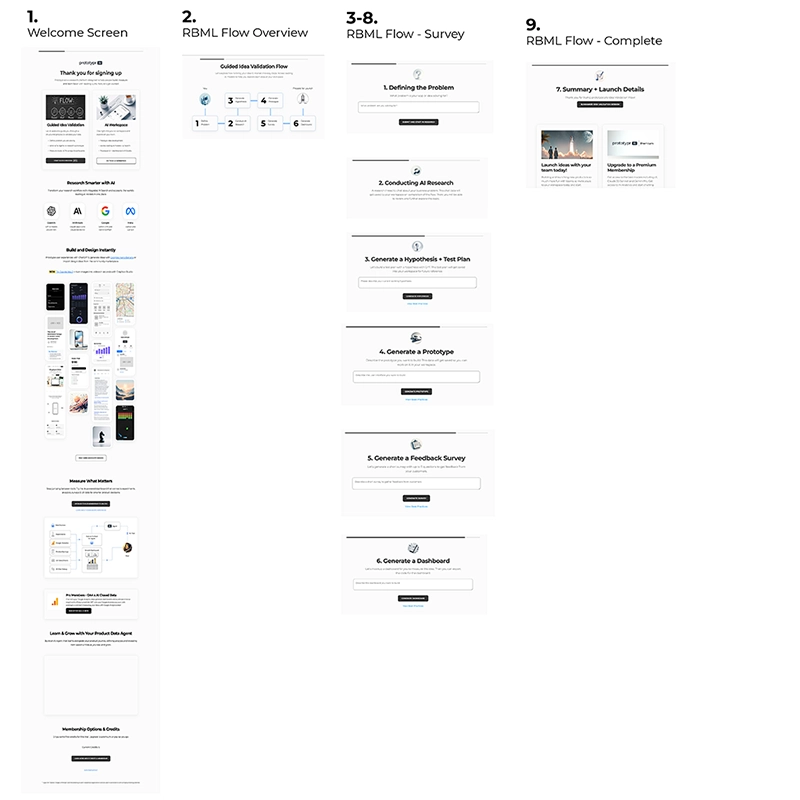
The V3 onboarding flow in all its glory
Now, if you’ve worked in growth, product, or experimentation, the idea of going from researching the idea > defining the problem + hypothesis > building the prototype > measuring the result probably feels familiar. It’s structured. Disciplined. It’s how you move from idea to validation in a repeatable way.
As a growth system, V3 makes quite a bit of sense for the right audience. But as an onboarding experience, it crashed and burned.
And let me tell you, the data was not pretty. A quick data pull using my fine tuned Google Analytics MCP agent revealed some truly awful numbers:
| Onboarding V3 KPI | Value |
|---|---|
| Onboarding Start Rate | 27% |
| Onboarding Skip Rate | 62% |
| Generate Anything Rate | 5% |
| Onboarding Finish Rate | <1% |
| 1 day Retention Rate | 12% |
In short, most users never even experienced the system I had built.
And with hind sight being 20/20, the main issue wasn’t just the amount of steps I had asked new users to try. The main issue was that I asked users to “think” this way.
V3 assumed that a brand‑new user:
- Already had a clearly articulated problem
- Was comfortable writing hypotheses
- Understood how surveys and dashboards fit into validation
- Was willing to think several steps ahead before seeing any output
That was a huge ask. Even more so in the first 5 minutes of the experience.
Upon reflection, I’d say my Growth Lead bias was definitely at fault here. I designed onboarding for how I approach growth as a system, and not for someone arriving with curiosity, partial intent, or a loosely‑formed idea that they wanted to explore.
The very first step “Define the problem you are trying to solve” turned out to be a silent blocker.
In theory, it’s a great prompt. In practice, many users were still in exploration mode. They didn’t yet have language for the problem. Some were most likely just testing the tool. Others were seeing what was possible. Asking for clarity before showing possibility created friction.
And each subsequent step compounded the cognitive load. Even though the system could generate outputs at every stage, the mental cost of understanding why each step mattered came before any tangible reward.
What V3 really required was sustained attention, motivation, and context. The type of attention you only earn after delivering value.
One interesting insight that came out of this flow is that it might actually work well for an agent or a deeply contextualized AI collaborator. Given enough context, an agent can power through structured thinking without fatigue.
But humans are different.
For onboarding, V3 asked users to think like growth professionals before they had experienced why the system was worth learning in the first place.
So the problem with V3 was not the framework. It was the sequencing. Value must come before structure.
That realization became the foundation for V4.
Onboarding V4: Build Value First and Explain the Growth System Later
V4 flips the order of how value is introduced.
Instead of explaining the growth framework first, it asks users to build something real immediately. An app screen. A landing page. A dashboard. A user flow. Only after that does it introduce structure and language.
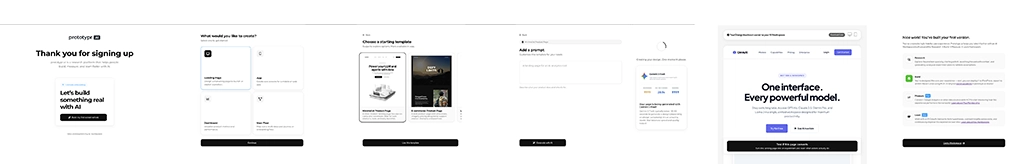
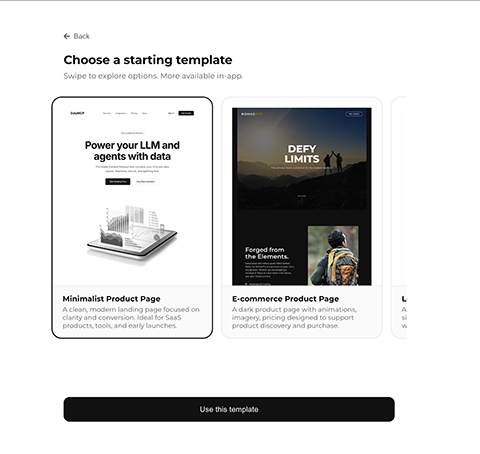
The V4 onboarding flow
Identifying the Problem Using Data
The data from V3 made one thing clear: most users never even started onboarding, and almost nobody finished it.
That meant onboarding wasn’t shaping behavior or retention. It simply wasn’t being experienced.
The Goal and Hypothesis
Improvements in start rate and completion rate were useful diagnostic signals. But they were not the primary objective.
The primary goal was improving retention.
The hypothesis was explicit:
HYPOTHESIS
Restructuring onboarding to focus on accelerating time‑to‑value (helping users build their first screen) will improve 1‑day retention for signed‑up users from 12% to at least 18%.
This was not a cosmetic UI change. It was a shift in mental model. A pre and post study provided the clearest signal.
The full experiment design, including baseline metrics, statistical thresholds, and success criteria, was documented inside the Growth Dashboard
Documenting the experiment before launching the redesign ensured that the outcome could not be rationalized after the fact. The hypothesis, thresholds, and measurement framework were locked in advance. That discipline is central to the Research → Build → Measure → Learn process.
Why V4 Works
The biggest change in V4 was not visual. It was sequential.
V3 required understanding before reward. V4 delivers reward before explanation:
-
Value first, explain later
Users generate something real before learning frameworks or terminology. Value comes before understanding.
-
Introduce structure during momentum
While the user interface was generating, the Research → Build → Measure → Learn (RBML) framework is introduced as context rather than instruction.
-
Replace generic CTAs with contextual next steps
Instead of a vague “Continue” CTA, users are guided based on what they just created.
The result is an onboarding flow that feels like progress rather than instruction.
Designing the V4 Onboarding Experience
The V4 onboarding flow is built around a small number of intentional moments.
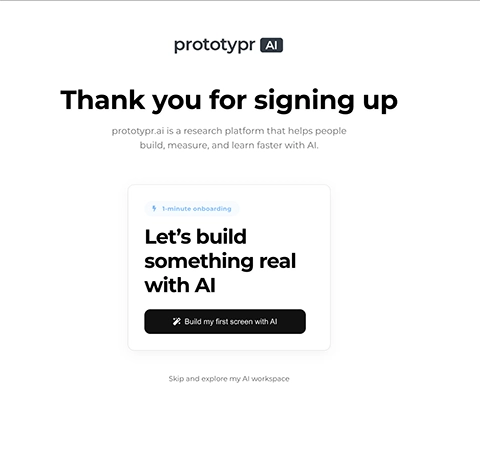
A simple start
The first screen asks one clear question: “Let’s create something real with AI.” Two actions. No scrolling. No explanation.
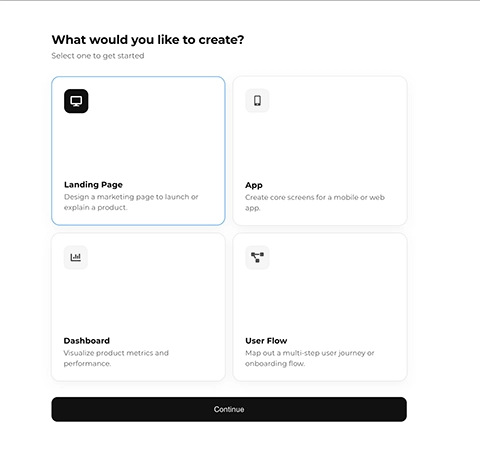
Intent without articulation
Users choose what they want to build without being asked to define a problem upfront.
Introduce helpful templates
Templates reduce blank-canvas anxiety. Dashboards and flows skip them for speed.
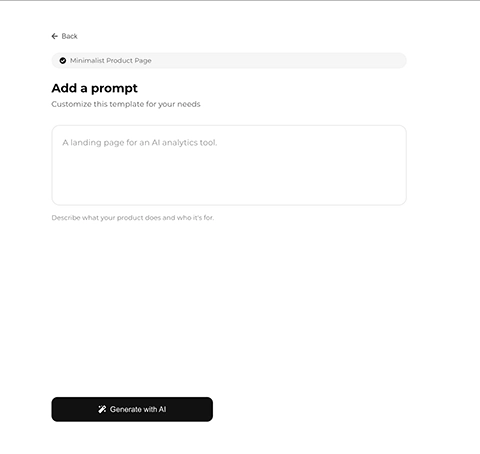
Customize template with a prompt
After the template selection you can add a prompt to customize your design (only for landing pages and apps).
Generation as a teaching moment
While the user interface is being created, lightweight context is introduced without breaking momentum.
Output before obligation
Users can preview and download their work before being asked what to do next.
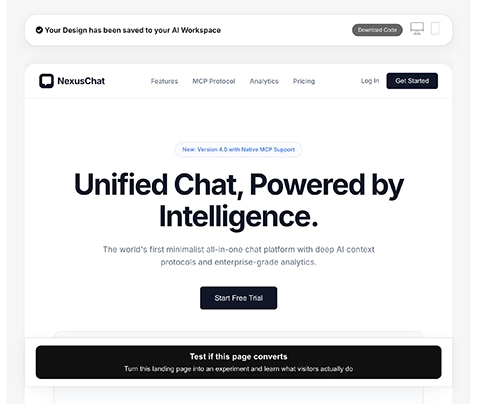
Completion before continuation
The Build step is marked complete. The broader framework is introduced as the next layer, not as a prerequisite.
Speed is what makes this flow possible. Keeping generation under ~60 seconds preserves momentum and reinforces the feeling of progress. Without Gemini Flash, i’m not entirely sure how effective this flow would be.
Measuring Onboarding Experiences with Google Analytics
One of the advantages of building inside prototypr.ai is that measurement is part of the workflow, not something bolted on later.
Before launching V4, I already had a live Google Analytics reporting experience built for V3 using the GA4 AI Dashboard Generator. The core events were intentionally simple and durable: onboarding_start, generate, onboarding_finish, and key downstream actions. That consistency made comparison straightforward.
For V4, I introduced additional tagging to capture the type of experience users selected at the start of onboarding. Whether someone chose to generate a dashboard, app screen, landing page, or user flow became part of the event data.
That extra context served two purposes. First, it allowed us to personalize the generation screen by lightly introducing the platform and the Research → Build → Measure → Learn framework in a way that matched user intent. Second, it powered contextual calls to action on the preview screen, suggesting next steps aligned with what the user had just built.
The reporting layer itself was generated using natural language. Instead of manually configuring charts in GA4, I described the onboarding funnel and asked the system to visualize progression from start to generation to completion, along with Day 1 retention by cohort. Within seconds, the dashboard was live.
If you want to see how that works in practice, I recorded a YouTube short walkthrough of the ai dashboard generator here: AI Dashboard Generator featuring a fine tuned GA4 GPT x Gemini Flash.
The Real Measurement Advantage
Beyond visualization, the real leverage came from conversation. Because the analytics layer is connected to the AI Growth Advisor through a custom GA4 integration, I could query live data directly. Some metrics were pulled in real time using the GA4 agent. In other cases, I reviewed cohort data and brought it into the discussion for interpretation.
In the first weeks after launching V4, my routine was consistent. Each morning, I would review the onboarding metrics and discuss them inside the system. The model could interpret funnel shifts, compare against historical baselines, and highlight meaningful changes in behavior.
That is what a growth partner looks like in practice. Measurement is not just charts. It is dialogue with context.
Because the foundational reporting was already in place from V3, and because new tagging enriched the context for V4, the impact of the redesign was visible quickly. The experiment moved from hypothesis to evidence without friction.
With measurement in place and visibility clear, the only question left was whether the redesign actually changed behavior.
Experiment Results: Did “Lead with Value” Improve Retention?
Onboarding V4 launched on January 26, 2026. I conducted a pre and post analysis comparing the 30 days before launch to the first 14 days after launch, stopping once statistical significance was reached.
The hypothesis threshold was 18 percent Day 1 retention.
The result exceeded that threshold.
| Period | Days | Sample Size | Retained (D1) | D1 Retention Rate |
|---|---|---|---|---|
| Pre (Dec 27 – Jan 25) | 30 | 509 | 62 | 12.18% |
| Post (Jan 26 – Feb 8) | 14 | 305 | 57 | 18.69% |
% Lift: +53%
Confidence Level: 98.9%
Day 1 retention increased from 12.18 percent to 18.69 percent. That is a 6.5 percentage point absolute increase and a 53 percent relative lift.
Statistical confidence reached 98.9 percent.
This was not incremental. It was structural.
Secondary Metrics: A Positive Behavior Shift
While retention was the primary KPI, onboarding progression metrics explain why retention improved.
Start rate increased from 26.85 percent to 85.5 percent. Skip rate fell from 61.96 percent to 7.8 percent. Generation rate increased nearly tenfold. Completion moved from negligible to meaningful.
The flow was no longer being bypassed. It was being experienced.
The “Lead with Value” philosophy did more than improve individual metrics. It reshaped the early product loop. More users started. More users generated. More users finished. And more users returned the next day.
That is what activation looks like when value precedes structure.
| KPI | Pre (V3) | Post (V4) | Absolute Change | % Lift |
|---|---|---|---|---|
| Onboarding Start Rate | 26.85% | 85.5% | +58.65pp | +218% |
| Onboarding Skip Rate | 61.96% | 7.8% | -54.16pp | -87% |
| Onboarding Finish Rate | 0.33% | 29.4% | +29.07pp | ~8,800% |
| Generate Rate | 5.33% | 49.7% | +44.37pp | +832% |
The “lead with value” philosophy didn’t just improve onboarding metrics. It altered the early product loop. More users started. More users generated. More users finished. And more users came back the next day. That’s what the start of a healthy activation funnel looks like
In Summary: 5 Key Insights from Rebuilding Onboarding with AI
There is so much more I'd love to explore with onboarding. But this was a great first step to improving the initial experience for new users on prototypr.ai. Below are five key insights you can take away and apply immediately:
1. Time-to-Value Is the Real Activation Metric
Start rate and completion rate are diagnostic. Retention is decisive. The 53 percent lift in Day 1 retention did not come from better copy. It came from faster value. Onboarding should not explain your system. It should prove it is worth learning.
2. Sequence Beats Explanation
V3 wasn’t “wrong.” It was simply ordered incorrectly. Asking users to think like growth professionals before they experienced output created cognitive friction. When value precedes explanation, friction drops and activation rises.
3. AI Becomes Powerful When It Has Context
The biggest difference in this workflow wasn’t using AI. It was using AI with memory and data access. When your AI advisor understands your analytics stack, historical experiments, UX changes and conversation history, it stops giving generic advice and starts compounding learning. This is where prototypr.ai becomes more than a UI generator. It becomes your growth intelligence layer.
4. Different Models for Different Jobs
Strategy, structure, and speed require different strengths. ChatGPT shaped the strategy. Claude structured the experience. Gemini was the engine that made it all work. How these models were orchestrated as a system mattered more than model preference. Speed made build first viable. Fidelity made the experience coherent. Context made the strategy intelligent.
5. Build a System, Not Just a Feature
The onboarding redesign was not a one-off improvement. It became a documented experiment with a hypothesis, baseline, and outcome. When learning is stored, the next iteration starts smarter than the last. That is how Research → Build → Measure → Learn becomes compounding.
One Final Closing Thought
If you take one thing away from this article, let it be this: AI doesn’t replace product thinking. It accelerates it. If you connect it to your data, your experiments, and your history you can move it from a generic chatbot to a functioning growth partner.
Onboarding V4 wasn’t just a redesign. It was proof that when AI is integrated into your growth system, you can move from idea to validated learning faster, and with measurable impact.
Thanks for reading!
About the Author
Hi, my name is Gareth. I’m the creator of prototypr.ai and the founder of a startup called Data Narrative. If you enjoyed this post, please consider connecting with me on LinkedIn.
If you need help with full stack data initiatives or are looking into building Generative AI applications, please feel free to reach out. I love building GenAI and full stack measurement solutions that help businesses grow.
Until next time!
About prototypr.ai and The Growth System Behind This Experiment
Everything described in this article was built and measured inside prototypr.ai, with the exception of the final polish of the experience, which was done in my IDE.
prototypr.ai is a suite of AI-powered growth tools designed to help teams move from idea to validated learning using a structured Research → Build → Measure → Learn workflow.
The platform includes:
- An AI Growth Advisor connected to your analytics, experiments, and historical context
- A Studio experience for generating UI, dashboards, landing pages, and flows
- An AI Dashboard Generator for creating GA4 dashboards with natural language
- Experiment tracking and documentation built directly into the Growth Dashboard
The majority of these tools featured above require a Plus or Pro membership. With Plus, you can also access MCP tools which makes it easy to layer in additional context into your growth conversations. It's an incredible unlock for you and your AI Advisor. If you'd like to learn more about our open MCP tools, please check them out here: Explore prototypr.ai MCP Tools.
And if you have feedback, feature requests, or ideas for improvement, I would genuinely love to hear from you.
Thanks again!