How to Build a Google Analytics Dashboard with AI
by Gareth Cull
LAST UPDATED: 2026-11-09
What You'll Learn
In this guide, you’ll learn how to:
- Use Dashboard AI & prompts to build a Google Analytics landing page dashboard
- Create scorecards and a traffic-source table for users, sessions, and sign-ups
- Review and edit the GA4 API queries behind your dashboard components
- Add a webpage engagement component and adapt it to your event tracking
- Save your dashboard and use it to investigate landing-page performance
This guide is for marketers, product managers, analysts, and founders who want to explore GA4 data with AI. You don’t need to know python or SQL, but you will need a GA4 property connected to your prototypr.ai workspace
Introduction
Building dashboards is becoming less about manually configuring charts and more about describing the questions you want your data to answer.
In this tutorial, we’ll use Dashboard AI, a tool built at prototypr.ai, to create a landing page report using natural-language prompts and connected data via the Google Analytics API. Our tutorial will be focused on reporting on the Dashboard AI landing page, so you can better understand how we use this product to review engagement with our own webpages.
We’ll build a KPI summary, compare traffic sources using session-based reporting, and add a visual engagement component that brings together scroll depth, an image of the page, KPI scorecards, and on-page events. Together, these components help us understand who visits the page, which traffic sources contribute to sign-ups, and how people interact with its content.
We’ll create the report component by component and inspect the API queries behind the results, rather than relying on chart labels alone. Along the way, we’ll clarify the page filters, attribution, and conversion definitions that make the report useful.
Table of Contents
Getting Started
Understanding Prerequisites for this Guide
In order to successfully generate a dashboard using Google Analytics data in Dashboard AI, you'll need:
- prototypr.ai account
- Google Analytics account
- Connect your Google Analytics account to a prototypr.ai workspace.
If you need help connecting your Google Analytics account to prototypr.ai, please read our guide:
How to Connect Google Analytics to prototypr.ai.
Now with our prerequisites out of the way, let's get started building our first AI dashboard!
What We’ll Build Today
In order to build a good dashboard, you often need to start with a good question or series of questions. Today, our questions are going to be focused around helping us understand the performance of a particular landing page in driving new product signups.
Typically, when I build a landing page for a new product, I want to understand the following about its performance:
- How effective is our content at driving trial or new signups?
- What sources of traffic are the most efficient at converting visits to signups?
- And how are users engaging with our page? What content elements are they engaging with, are they watching videos, etc.
The dashboard we are going to be building will help us answer these questions. Obviously, the questions above isn't an exhaustive list, but a small focused subset of questions in order to keep this tutorial short and to the point. But the skills you learn in this tutorial should be able to help you expand this landing page report in any direction you want.
So in this tutorial, we'll be measuring the performance of the Dashboard AI landing page by building the following dashboard with AI (I know it's kinda meta):
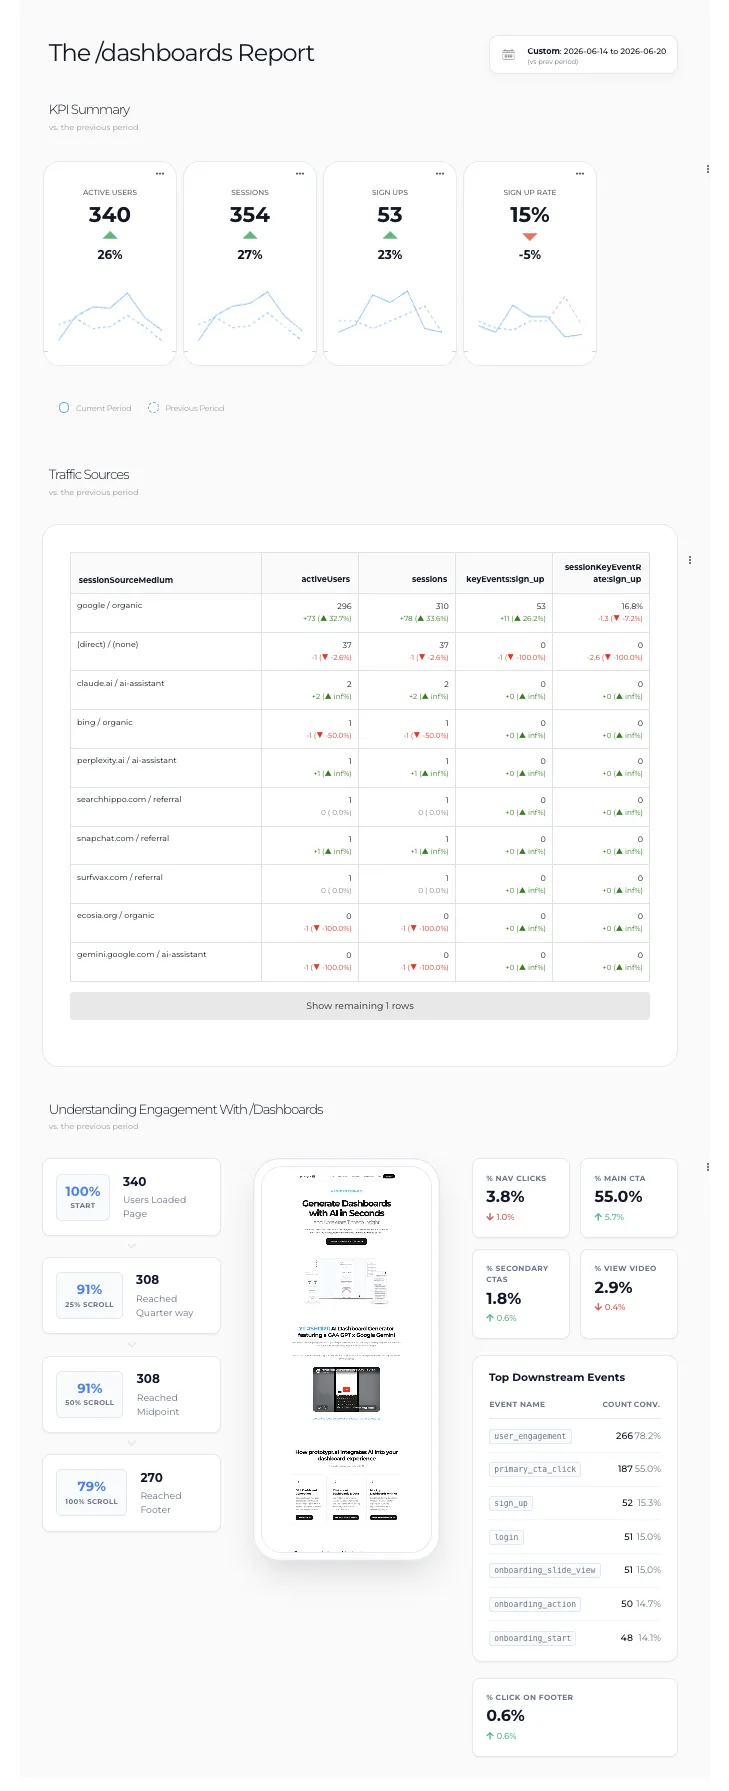
This dashboard consists of a new of different generative data components:
- Dashboard Title with a Date Selector
- Section Titles to help define sections in the report
- Scorecards that define our primary KPI
- Table that segments our KPI by the source of a session
- Landing Page Engagement that visualizes engagement on the page
These are not the only data visualizations you can build in Dashboard AI, there are many others to choose from including: Time Series, Bar Charts, Pie Charts and more!
About the data in this dashboard
The data shown is real Google Analytics data for the Dashboard AI product page from a previous time period. Every data point in this dashboard has an underlying Google Analytics API query that is exposed for you (the end user) to verify and edit if needed. So, as you work through this tutorial, feel free to repurpose the prompts for your own reporting use case.
One other thing to note, the prompts below leave the date range unspecified. When you build a dashboard with AI in prototypr.ai, all of the components default to displaying yesterday's data. Once you've saved your dashboard, feel free to update the timeframe using the date selector that lives within the Dashboard Title component.
Now let's start building!
Tutorial: Building a Google Analytics Dashboard with AI
Let's begin by building a landing page report for the Dashboard AI landing page. As you work through this guide, feel free to adjust the prompts below for your own use case. To start, open up Dashboard AI from within your AI Workspace by clicking on the report icon in the side menu. Then create your first data component: the dashboard title.
Step 1: Create the Dashboard Title
Enter the following prompt in Dashboard AI to create a dashboard title component.
A dashboard title called The /dashboards Report
Dashboard AI will then generate a dashboard title component introducing the report, complete with a date selector which you can click on. All dashboard components generated default to yesterday's date, but you can change the date after you save it.

Edit the Dashboard Title
If you need to edit the title of your dashboard, just click into the title and update. It's pretty straightforward.
Step 2: Build the KPI Summary
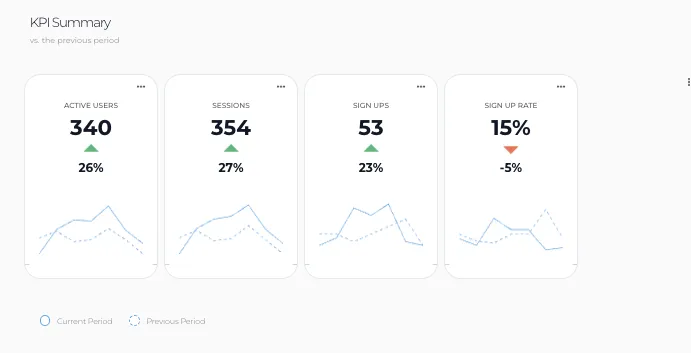
Next, let's create a section title and a few scorecards for users, sessions, signup key events, and signup rate.
a section title called kpi summary and a scorecard component of users, sessions, sign_up key events, sign_up rate
These scorecards give us a quick overview of traffic and sign up efficiency.
One thing you may have noticed was there was no landing page filter mentioned as part of the prompt. That was intentionally left out because I want to show you how easy it is to update these cards and the underlying API query.
How to Edit a Scorecard
After the scorecard component has rendered, click the kebab icon on the right side of the screen to open the edit API Query menu. In this menu, you can manage your scorecards, update the order they appear, delete, add or edit their underlying Google Analytics API query.
This functionality was to make Dashboard AI’s outputs more traceable, transparent and verifiable. Showing the underlying API query builds trust and enables users to easily verify the data being shown in the dashboard with their own code.
To access the query behind a scorecard, click on the EDIT icon , and the underlying Google Analytics API query will appear on the right hand side of the menu (as shown below).
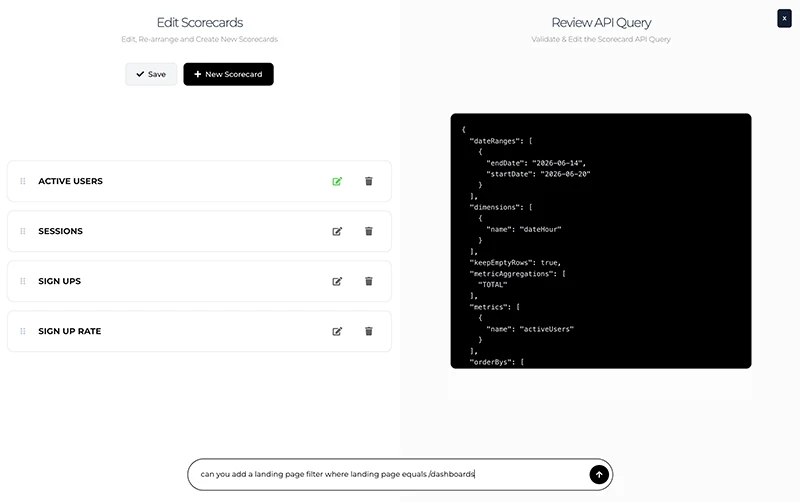
Then write the following prompt to add in the landing page filter to the query.
Add a landing page filter where landing page equals /dashboards
Repeat the process for each query then hit Save and you've successfully updated your scorecards in Dashboard AI.
Step 3: Build a Table to Compare Traffic Sources
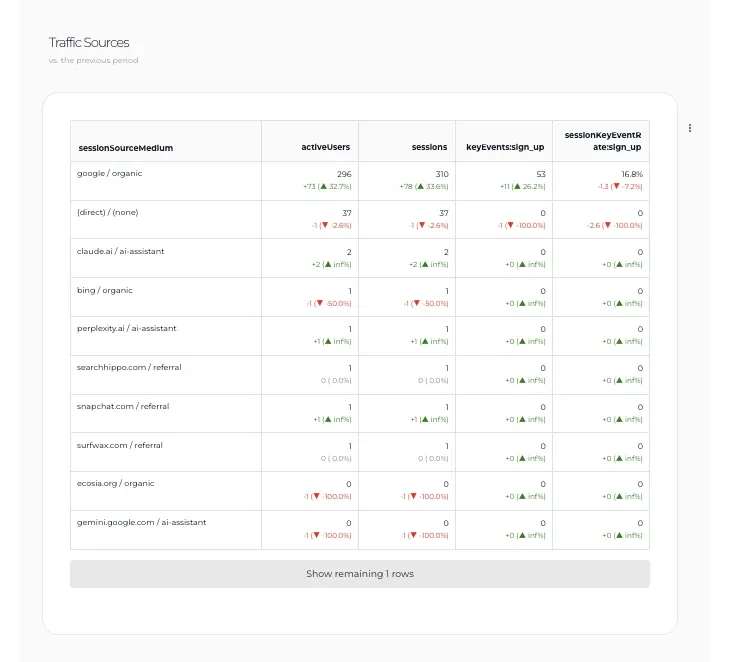
Next up, let's build a table to help us visualize where we are getting our traffic from (ie. the source and medium) and how efficient each source is at converting traffic to sign ups. As part of this prompt, we'll also generate a section title to add a bit more whitespace into the report.
a section title called Traffic Sources and a table of users, sessions, sign_up key events and sign up session rate by session source medium
The resulting chart should show daily user activity across the reporting period.
How to Edit a Table in Dashboard AI
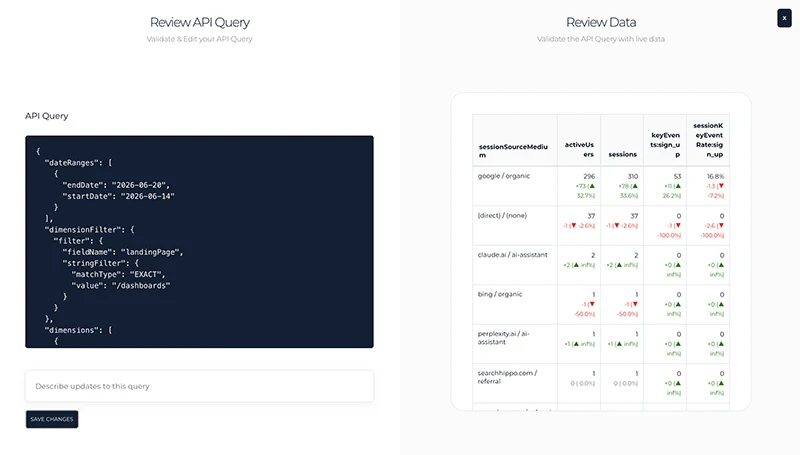
After your table has rendered on screen, click on the kebab menu icon just off to the right side of the table to open the edit API Query menu. This menu looks similar to the table, but shows the Google Analytics API Query on the left and the table data on the right.
Again, we intentionally left out the filter, so we can show how to add that in here. In the prompt box below, enter the following prompt:
Add a landing page filter where landing page equals /dashboards
Click enter on your keyboard to begin the update. You should see your table and query update and look similar to the image below:
Step 4: Visualize landing page engagement
This is the last section we are going to add to our dashboard for this tutorial. This "webpage engagement component" helps stakeholders understand how users engage with landing pages.
One of the things I love to do when presenting data about particular experiences and especially landing pages is to include a picture / screenshot of the experience. By adding an image of the experience, we can better understand context around the data and start to come up with better hypotheses to improve the experience. It also provides the model with additional context, so when it's analyzing the data, it can ground its analysis alongside a visual of the experience.
So, let's add the webpage engagement component for the Dashboard AI landing page
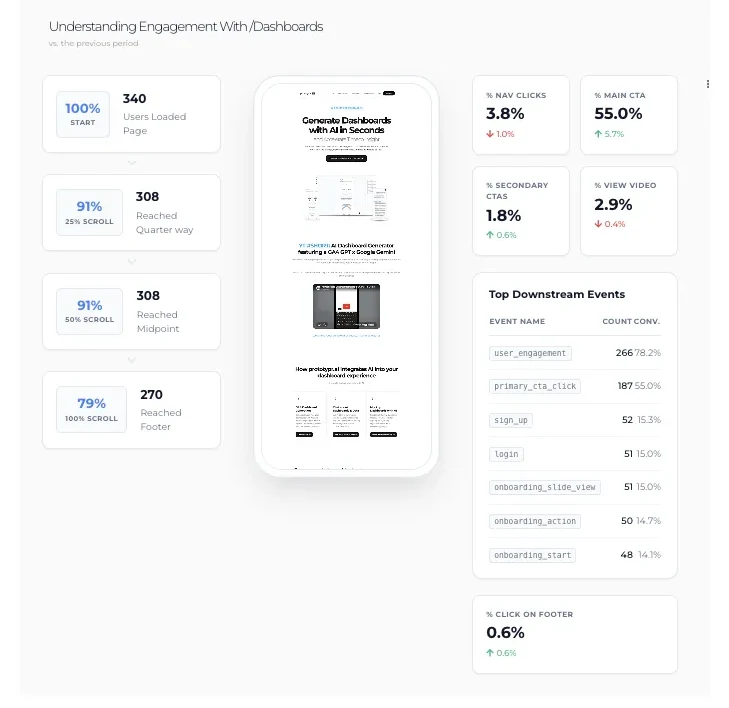
A webpage engagement component for /dashboards
This component works by creating two queries. One to understand scroll behaviour, and the other to understand user engagement with the page and subsequent downstream events.
Scroll behaviour is defined by a customEvent (or custom dimension) called customEvent:scroll_depth and looks for 3 values (25%, 50%, 100%) to calculate how far down the page users scroll. I personally like measuring scroll depth because it helps me understand how engaging the content i'm building is. For example, if only 50% of people are making it halfway down the page, then maybe I need to take a look the content again. Perhaps it's not resonating.
The right side of the component contains key engagement events that happen on the page. These events default to a few specific events:
primary_cta_clickwhich measures clicks on the primary cta of the experiencenav_clickwhich measures clicks on navigation elementssecondary_cta_clickwhich measures clicks on other secondary ctas typically found below the foldvideo_startwhich measures engagement with any YouTube videos on your pagefooter_link_clickwhich measures engagement links in the footer
How to Edit the Webpage Engagement Component
The great thing about this component, is that these scorecards are actually editable! Once again, you'll need to click on the kebab menu to the right of the component and open the edit menu.
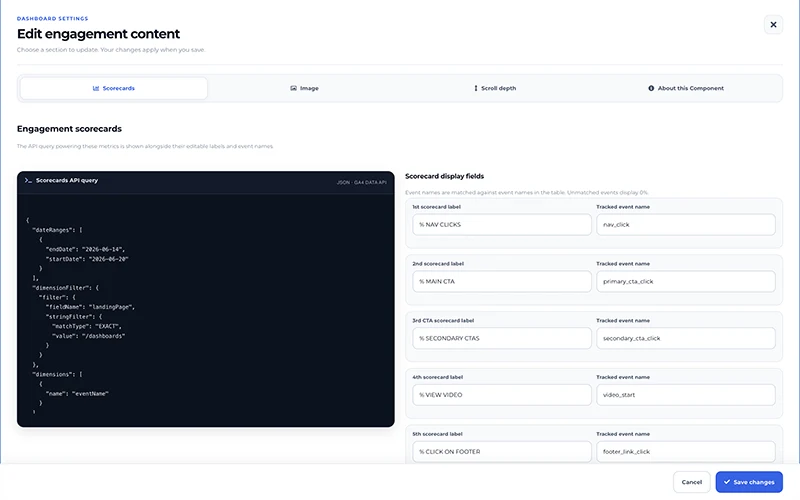
In this menu, you can choose a different scroll dimension and up to three values if you measure that behaviour slightly different than i do. You can also select up to 5 events that are triggered on the page, representing each of the 45 scorecards on that side of the component.
Alright! We've successfully created a new landing page report for our Dashboard AI landing page. Our final step is to save it so we can re-use it again and again.
How to Save a Dashboard in Dashboard AI
In the left hand side menu, click on the SAVE icon , fill out the Title, Description and tag it. Then click SAVE DASHBOARD. That's it!
Expanding on This Dashboard
As mentioned earlier, this was a simple report that can definitely be expanded on in many ways.
And because its so easy to generate dashboards with AI, I'd consider expanding it in the following ways:
1. SEO Summary
If you have already connected Google Analytics to Google Search Console, then you are already ahead of the game. Dashboard AI works with this data and can pull clicks, search impressions, SERP ctr and average rank into your dashboard. I'd consider adding in a few scorecards here a few tables across each of those metrics to better undestand how your pages rank.
2. Google Ads Summary
You can also pull Google Ads data into Dashboard AI via the Google Analytics API. This is particularly useful when you have created a campaign landing page and want to understand ad costs and returns on your advertising investment. Google Ads coupled with landing pages are also a great way to test new product concepts or positioning. I'd recommend creating a section with a few scorecards and tables specific to better understanding Cost, Cost Per Click, Cost per Conversion and Impressions across your particular campaign dimensions. If you haven't done so yet, I'd recommend reading Google's support article on how to connect Google Ads to Google Analytics
3. Device Summary
If I were to pick one more section to report on for this landing page, it would be probably be related to understanding how users engage with the page across mobile and desktop devices, as behaviour can vary quite a bit. I'd use the metrics we defined our guide above, broken down by device category and display it as a table.
4. Bring in More Data with MCP
Dashboard AI Chat natively supports MCP Tools, so connecting your workspace to a MCP data connector like an open source Search Console MCP would enable you to bring QUERY / KEYWORD level data into your report. MCP offers a way to bring more data into your dashboards through chat and often leads to much richer analysis and insights into the performance of your experiences.
Tips for Building Dashboards with AI
Here are a few things that I've learned to make it easier for AI models to build dashboards:
-
Use API Language when Prompting
If you understand the technical names for custom dimensions or specific events you have set up, use those in your prompts. For example, sometimes I'll use event language like: "build a scorecard for keyEvents:sign_up".
-
Use Google's GA4 Query Explorer
Sometimes, when I have a complex API query that I want to build that involves multiple filters, I'll head on over to the GA4 Query Explorer tool and manually build that query with drop downs and preview what that data should look like. The primary benefit of doing this is I can export the JSON API query and pass it into my prompt field in Dashboard AI. It's also a good place to validate API Queries that have been generated in Dashboard AI.
-
Iteratively Edit Your Queries
In this guide, I intentionally left my prompts simple. The reason being is that its often easier and more accurate to just edit the API Query with a follow-up prompt.
Conclusion
Thanks so much for reading prototypr.ai's guide: How to build a Google Analytics Dashboard with AI. I hope you enjoyed it. If you'd like to test out, please feel free to sign up through our Dashboard AI landing page. If you have any feedback about this article, please feel free to reach out to Gareth Cull on Linkedin.
Happy Generating Dashboards with AI!
Dashboard AI FAQ
Dashboard AI is a prototypr.ai tool that helps you build dashboards using natural-language prompts and the Google Analytics API. You can generate components such as scorecards and tables, review the API queries behind your data and even ask an AI model like Gemini to summarize the dashboard for insights.
No. You can create dashboard components using natural-language prompts without knowing the Google Analytics API. However, familiarity with GA4 API metrics, dimensions, and event names can help you write more specific prompts and verify the generated queries.
Yes. Every prototypr.ai member receives a monthly inference allowance to try the platform. Paid upgrade options are available inside the app if you need more capacity.
Click the image in the component to open a modal, then select an image saved in your prototypr.ai account. You can use a screenshot of your landing page to provide visual context alongside your engagement data.
You can share your dashboards by inviting people to your AI Workspace. Open the workspace where you connected your Google Analytics account, then click INVITE TEAM in the top-right corner.