multi-modal model, abstract art, minimalist, white background, ray tracing - DALL·E 3 via prototypr.ai
Multimodal AI Use Case: Transforming mockups into code with GPT-4 Vision
 Gareth Cull
- What is a multimodal ai model? Multimodal models are AI models that can interpret, analyze, and understand information across a variety of different modalities, such as text, images, video and audio.
- What is GPT-4 with Vision? GPT-4 with Vision is a multimodal OpenAI model that can help you understand the content of an image, and then take action on this data in the form of a prompt.
- What will I learn by reading this article? You will learn about multimodal use cases such as converting mockups to code, how to get started using GPT-4V and what I learned converting a dashboard mockup into a prototype.
Introduction
I can't believe this is possible.
Being able to take an image of a mockup or design and turn it into code is incredible.
I've been lucky enough to have the opportunity to play with the GPT-4 Vision model by OpenAI and wanted to share my initial impressions about what I learned building a GPT-4V solution on prototypr.ai.
So, let's get started!
Table of Contents
This article will cover the following:
What are multimodal AI models?
Multimodal models are artificial intelligence models that can interpret, analyze, and understand information across a variety of different modalities, such as text, images, video and audio.
Multimodal models are designed to perform tasks that typically would require human-like perceptual and cognitive abilities.
The term "multimodal" comes from the word "modality," which in the context of data processing refers to the type of data or the way data is presented. The "multi" prefix indicates that the models are dealing with more than one modality at a time. This ability to process multiple types of data simultaneously allows multimodal models to capture a richer understanding of the information, which can lead to more accurate predictions, insights, and better performance across a variety of applications.
What is GPT-4 with Vision?
GPT-4 with Vision is a multimodal OpenAI model that can help you understand the content of an image, and then take action on this data in the form of a prompt.
These actions can include asking the model questions such as ‘what is in this image’ and then using the answer the model provides to perform a specific task.
What GPT-4V use cases am I exploring?
I’m currently using GPT-4V as an alternate way to start the prototyping process and enhance my workflow.
In the video below, I provide the model with a simple sketch of a dashboard and the model outputs a first draft of the UI that I can subsequently build on and polish up. The software that I integrated GPT-4V into is called ui_w/ AI Studio and it's part of the prototypr.ai suite of Generative AI products.
I'm also curious in testing out GPT-4 with Vision as a way to support building out analytics requirements.
Imagine uploading a picture of a user experience and then asking it to provide a standardized set of Google Analytics events that can be used to measure the experience. I think this could be a pretty interesting use case, especially if GPT-4V also offered up some code to implement in addition to guidance around KPIs to monitor. It feels like there is something there and I'll have to look into this some day.
So how does one get started with GPT-4V?
At the time of this posting, GPT-4 with Vision is currently available to developers who have access to GPT-4.
If you are in this camp and are interested in testing this out, i've included some code below. First thing you need to do is install the OpenAI python module below:
pip install openai
Then use the following code to test out what is in an image. I've included a link to my dashboard mockup that I converted to code as part of the request. Here's how you can call the GPT-4 with Vision API:
from openai import OpenAI

client = OpenAI()

response = client.chat.completions.create(
  model="gpt-4-vision-preview",
  messages=[
    {
      "role": "user",
      "content": [
        {"type": "text", "text": "What’s in this image?"},
        {
          "type": "image_url",
          "image_url": {
            "url": "https://www.prototypr.ai/static/img/blog_assets/hand_drawn_dashboard_mockup.jpg",
          },
        },
      ],
    }
  ],
  max_tokens=300,
)

print(response.choices[0])
Here's the actual image that I used as an input:
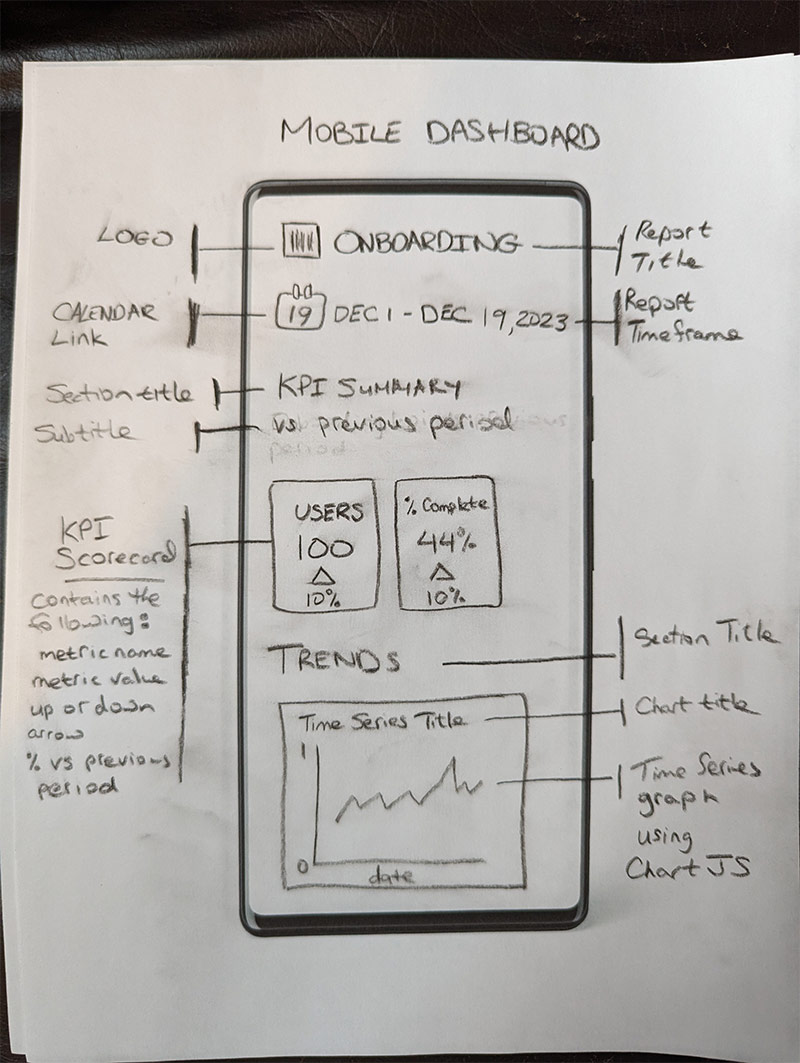
a mockup of a hand-drawn dashboard for testing GPT-4 with Vision
If your API request is successful, you should see GPT-4V output something that reads like this:
The image shows a hand-drawn sketch of a mobile dashboard design. The sketch appears to be a wireframe layout for a user interface (UI) that would be used in an app or a website for mobile devices. The design includes several elements:
"MOBILE DASHBOARD" seems to be the title of the page or app at the top center of the design.
A "Logo" placeholder is positioned on the top left corner.
There is a mention of "ONBOARDING" as a section header on the top right, along with an icon and a date range "DEC 1 - DEC 19,2023."
Below that, on the left, there's a "CALENDAR Link" and a section titled "KPI SUMMARY vs previous period" which explains that the KPI Scorecard "contains the following: metric name, metric value, up or down arrow, % vs previous period."
In the middle section labeled "KPI Scorecard," there are examples of what could be performance metrics with a user count "USERS 100 10%" and a percentage complete "44% 10%."
On the bottom left, there's a section labeled "TRENDS" with "Time Series Title" and a sketch of a graph chart which is labeled as a "Time Series graph using Chart JS."
To the right, there seem to be instructions for additional section titles and details including "Report Title,"
Pretty incredible. Isn't it?
So what did I learn on my GPT-4V travels?
Here are 4 key takeaways:
1. Descriptions of images are on point and incredibly accurate
This was way better than I imagined. Just seeing how GPT-4V describes a hand drawn dashboard was really eye opening. It was so accurate, that I wasn’t surprised it could then turn my image into code.
2. The output of code from a mockup is very good and offers a great starting point for a prototype
I’m still in awe about this, but the fact that you can take a sketch or a screenshot and output a coded prototype is remarkable. From my early experiments with getting the vision model to output specific charts using ChartJS, I found it worked quite well as the charts actually rendered on the screen!
3. Workflows and productivity can be enhanced with GPT-4V
Lately, when building user experiences, I’ve been thinking about what is more efficient.
Should I draw or describe a user experience with text in order to get that first draft codified? GPT-4V has me re-thinking my prototyping workflow, which is why I’m offering it as an option for customers.
I’ve also been thinking about how multi-modal models like GPT-4V can help capture and synthesize information as part of a brainstorming session. At the end of a meeting, one could simply snap and upload a picture (or a series of pictures) to the model and ask it to summarize the session, offering up key take aways and opportunities with the appropriate context. Again, it definitely feels like there is something there with this use case.
4. Latency is still top of mind when using GPT-4V
I imagine this will improve over time, but currently it can take around 30 seconds or so to convert an image to a prototype, which is a bit of a subpar user experience. But, I’m hoping that there will be a fine tuning solution sometime in the future where this speed issue could be addressed.
So, that’s my first adventure with GPT-4V!
Thanks for reading!
About the Author
Hi, my name is Gareth. I’m the creator of prototypr.ai and the founder of a startup called Data Narrative. If you enjoyed this post, please consider connecting with me on LinkedIn.
If you need help with your fine tuning initiatives or are looking into building with AI, please feel free to reach out. I love building GenAI and end-to-end measurement solutions that help businesses grow.
Until next time!